Example of an entry
With Labfolder you can add different content into a single entry. You can use the elements such as text, images, tables, graphs, file uploads, data elements, well plate templates and chemical structure element to shape your data entry in the way you want. Here is an example of how an entry may look like:
Now let’s recreate this entry step by step.
Explore the entry header
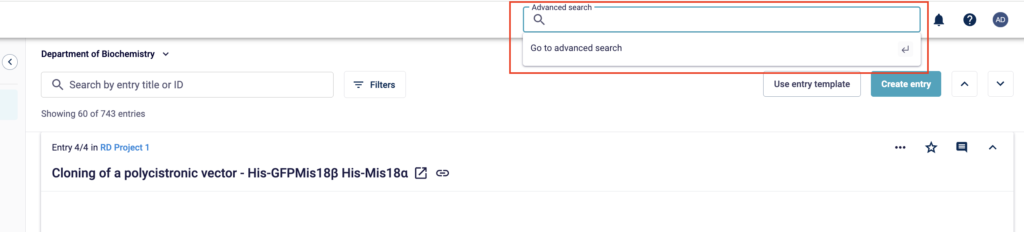
Although your data represent the most interesting part of your entries, you can find a number of useful information in the entry header. Based on your entry and the data within, the entry header shows you:
Now let’s recreate this entry step by step.
![]()
Author/ Creator: This is the person who created the entry and the only one who can perform changes to it.
![]()
Unique ID: The unique ID will show up as Entry N/Total, meaning the Nth entry out of the total number of entries you have in one project.
![]()
Entry title: Don’t forget to name your entry! Make it relevant to what is contained within, so you and others can easily identify the contents in the future.
![]()
Timestamps: The timestamps visible in the entry header are the dates on which the entry was created and then last edited. Besides that, custom dates can be added to achieve an even better organization. To ensure your timestamps are accurate, check that you have the correct time zone defined in your settings (Profile > Contact > Time zone).
See how you can add custom dates here.
![]()
Tags: ou can add tags to your entry to make it easier to retrieve later on. These should be also relevant to the content and make sense to search for.
See how you can add tags here.
See how you can add tags here.
Add text
When you have an entry in your notebook, you can start adding notes and data to it. Our ELN provides basic text formatting similar to Word, so you can format your text however it best suits your data.
- When you create a new entry, a text field will automatically appear in the toolbar for you to start working.
- After editing, click the Save icon in the top right corner of the element to save and close automatically.
- To add another text element, simply click the TT icon again and start typing!
Draw sketches
We know that letters and numbers are not the only way you will be expressing your data. This is why you are also able to make simple sketches in your ELN.
- Click the icon with the pencil to create a sketch element.
- You can draw freehand or create rectangles, circles, lines, arrows, arrowheads, and asterisks.
- Save your sketch by pressing the Save icon and you can close your sketch to move onto the next piece of data.
Insert tables and graphs
Insert a tables and Graph
In a research environment, data are often summarized in tables e.g. large data sets or buffer compositions. With the table element you can add data in the form of spreadsheets to your lab notebook. Similar to functions seen with Excel, the table element allows you to work with formulas as well as conditional formatting in a range of cells. Along with other features, you are also able to visualize your data using different chart formats.
- Click on the + Table Element icon to insert a new table element into your entry.
- A new table will open in a lightbox, where you are able to make edits similar to Excel.
- Give the table a name by entering it into the cell at top.
- Click on the cells of the table to insert and edit content.
Add a Graph to Represent Your Data
- Select the data you’d like to represent visually.
- Navigate to Insert > Chart.
- Choose the chart style that best suits your data (e.g., bar, line, pie).
- Double-click on the chart to start formatting and customizing it as needed.
- Click the Save icon in the top right corner to save your table and close the editor.
Upload files
An important reason for digitizing your data is to have them integrated all in one place. Therefore you are able to upload all file formats into your ELN. This covers Word, Excel, images, PDFs and more.
With the Free version of Labfolder you have 3GB available for your projects and data. By upgrading to the Advanced version you will be granted with up to 300GB storage per user.
- Click on the paper clip-shaped upload icon
- Choose upload the file from your computer or use Ctrl+V to simply paste images from your Clipboard.
Annotate uploaded images
With images uploaded into your notebook, you are able to sketch over and annotate them. Any changes, like annotations, made to images are saved in separate layers, so the original data will never be compromised by your edits.
- To annotate, click the pencil icon on the image element.
- Sketch freehand or make predefined shapes (rectangles, circles, etc.).
- Add text to describe annotations further.
- Click ‘Save’ to preserve the annotations on the image.
Incorporate Microsoft Office
Many experiments involve the collection of large datasets in form of Excel files. In order to easily attach them to the corresponding experimental records, you can use your ELN to upload and extract Excel files. Being able to display large data sets with easily understandable graphs is indispensable, therefore any Excel extraction will also maintain generated graphs, mathematical formulas, and conditional formatting.
- Upload your Excel file into an entry.
- Hover over the element and click on the extract icon that appears at the top-right corner.
- Your Excel file including tables and charts will be displayed in the respective entry element.
Please note we only support Excel files with xlsx extension (Office 2007 and superior).
Visualize PDFs
When you upload a PDF such as a scientific paper or a protocol, you can open and view it in your notebook. This allows you to compile in a single tool all the information for one specific experiment, including that one paper that gave you a great idea!
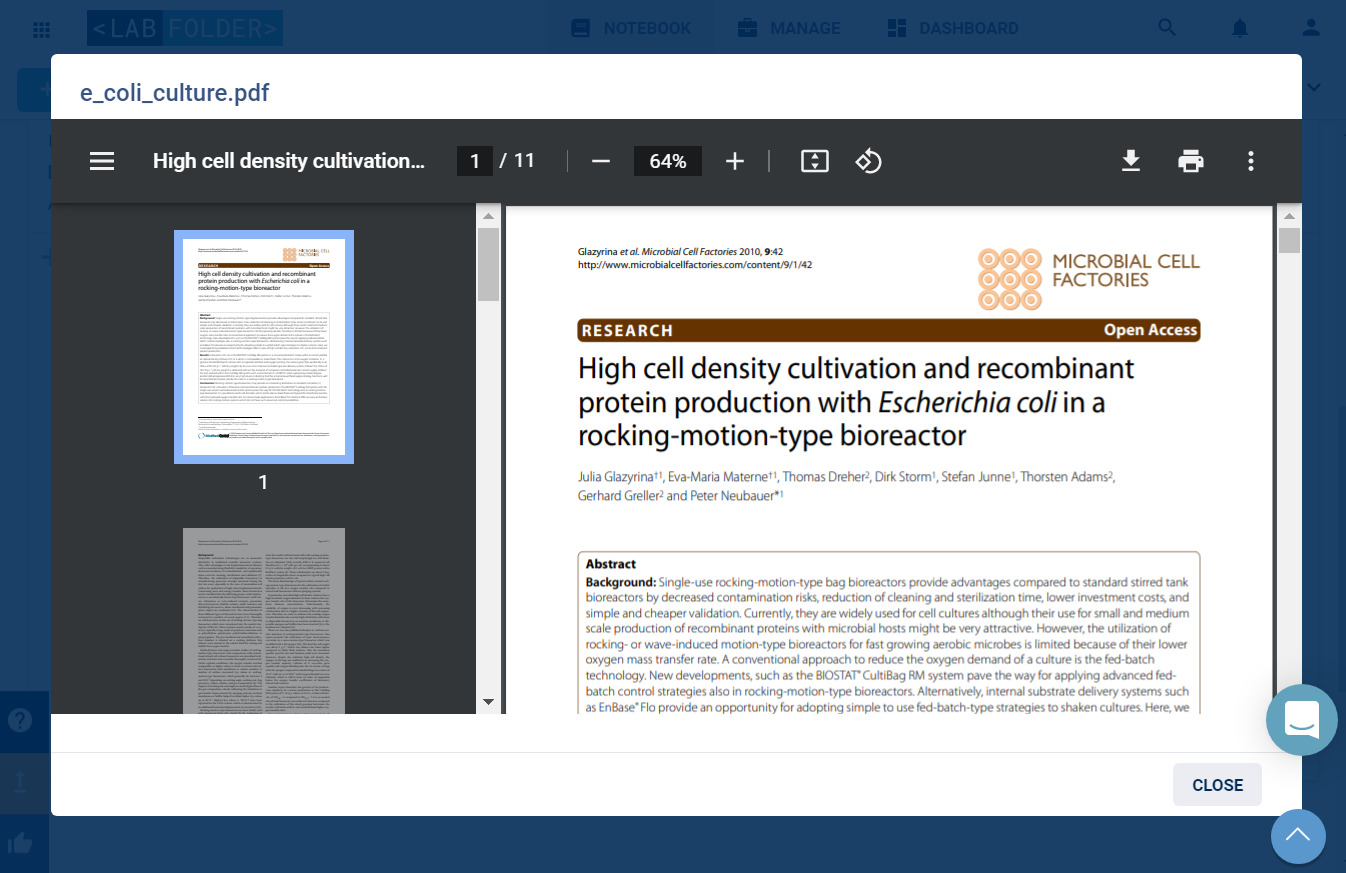
- Hover over the element and click on the eye icon that appears at the top-right corner.
- The PDF file will be opened in a lightbox where you can scroll up and down to read it.
Create Well Plate Layouts
Advanced version
Multi-well experiments are part of the daily routines – whether it is for transfection trials using 6-well plates or high-throughput applications in microtiter plates. Labfolder provides you with a tool for the easy design of templates for such complex experiments. Create layers for the different conditions that you are applying in your experimental setup and overview the entire well plate:
- Click on the Add Well Plate Element icon to insert a new template for multi well plates.
- A new element will open for you in order to select a format, reaching from 6-well up to 384-well plate layouts.
- In a new window you will be able to make modifications to the well plate template.
- Give the template a name by entering it into the cell at the top.
- Click on the tabs of the table to insert and edit different layers.
- Define numerical or descriptive layers to describe individual well conditions.
- The composite view allows for the comprehensive view of the entire well plate.
- By clicking the Save icon in the top right corner of the lightbox, your template will be saved and close automatically.
- Your Well plate template is ready to be download as excel, PDF or TPL.
Rearrange entry elements
Changing the order of the elements you created is very easy using our drag & drop interface.
- Hover over the crossed arrow icon in the top right corner of an element.
- Drag it to whichever position in your entry you wish it to go. The area initially colored in light blue will be highlighted in dark blue when you hover over it, indicating that you are able to place the block there.
- To resize a data block, hover your mouse over the side or corner of the element and use the arrows to adjust the scale.
- Release the mouse and you are done!
You can position up to 12 data elements within a row so you can layout your entry to suit your specific requirements!